norse.torch.utils.plot.plot_spikes_2d#
- norse.torch.utils.plot.plot_spikes_2d(spikes: Tensor, axes: Axes = None, **kwargs)[source]#
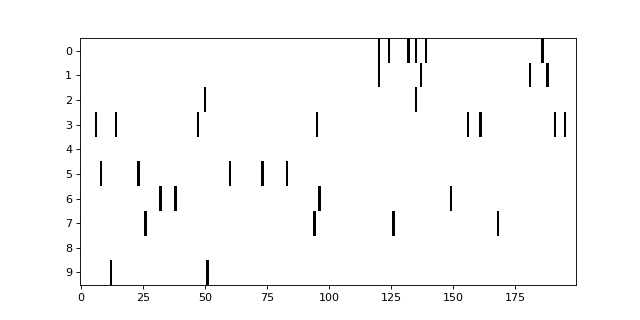
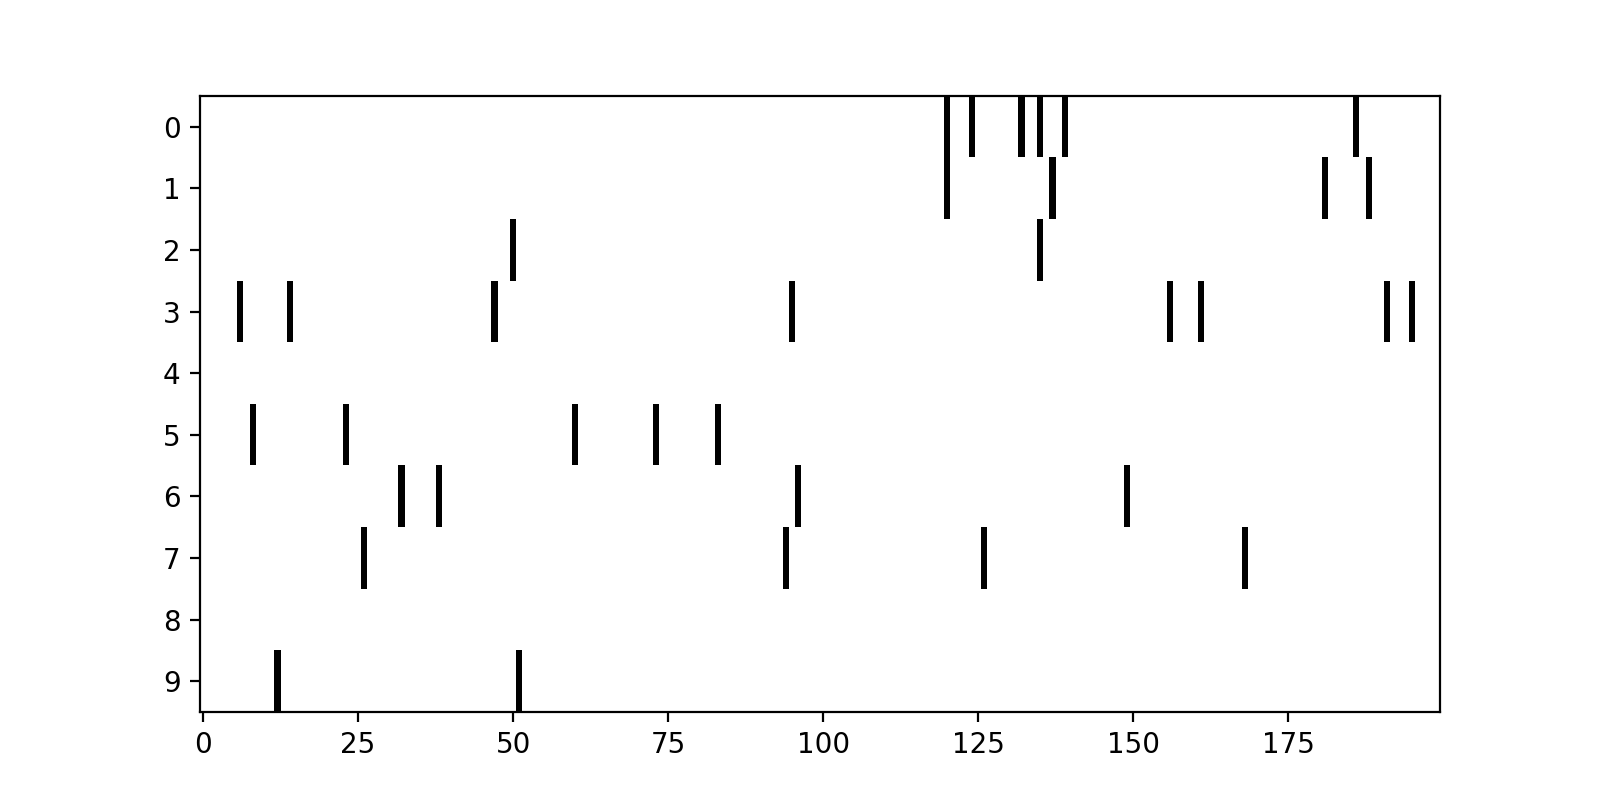
Plots a 2D diagram of spikes. Works similar to the
plot_heatmap_2d()but in black and white.- Example:
>>> import torch
>>> from norse.torch import LIF
>>> from norse.torch.utils.plot import plot_spikes_2d
>>> spikes, _ = LIF()(torch.randn(200, 10))
>>> plot_spikes_2d(spikes)
>>> plt.show()
(
Source code,png,hires.png,pdf)
- Arguments:
spikes (torch.Tensor): A tensor of spikes from a single layer in two dimensions. axes (matplotlib.axes.Axes): The matplotlib axis to plot on, if any.
Defaults to
matplotlib.pyplot.gca()- kwargs: Specific key-value arguments to style the figure
fed to the :matplotlib:meth:`matplotlib.pyplot.imshow` function.
- Returns:
An :matplotlib:class:`matplotlib.axes.Axes` object