norse.torch.utils.plot.plot_neuron_states#
- norse.torch.utils.plot.plot_neuron_states(states: List[Any], *variables: str, label: bool = True, axes: Axes = None, **kwargs)[source]#
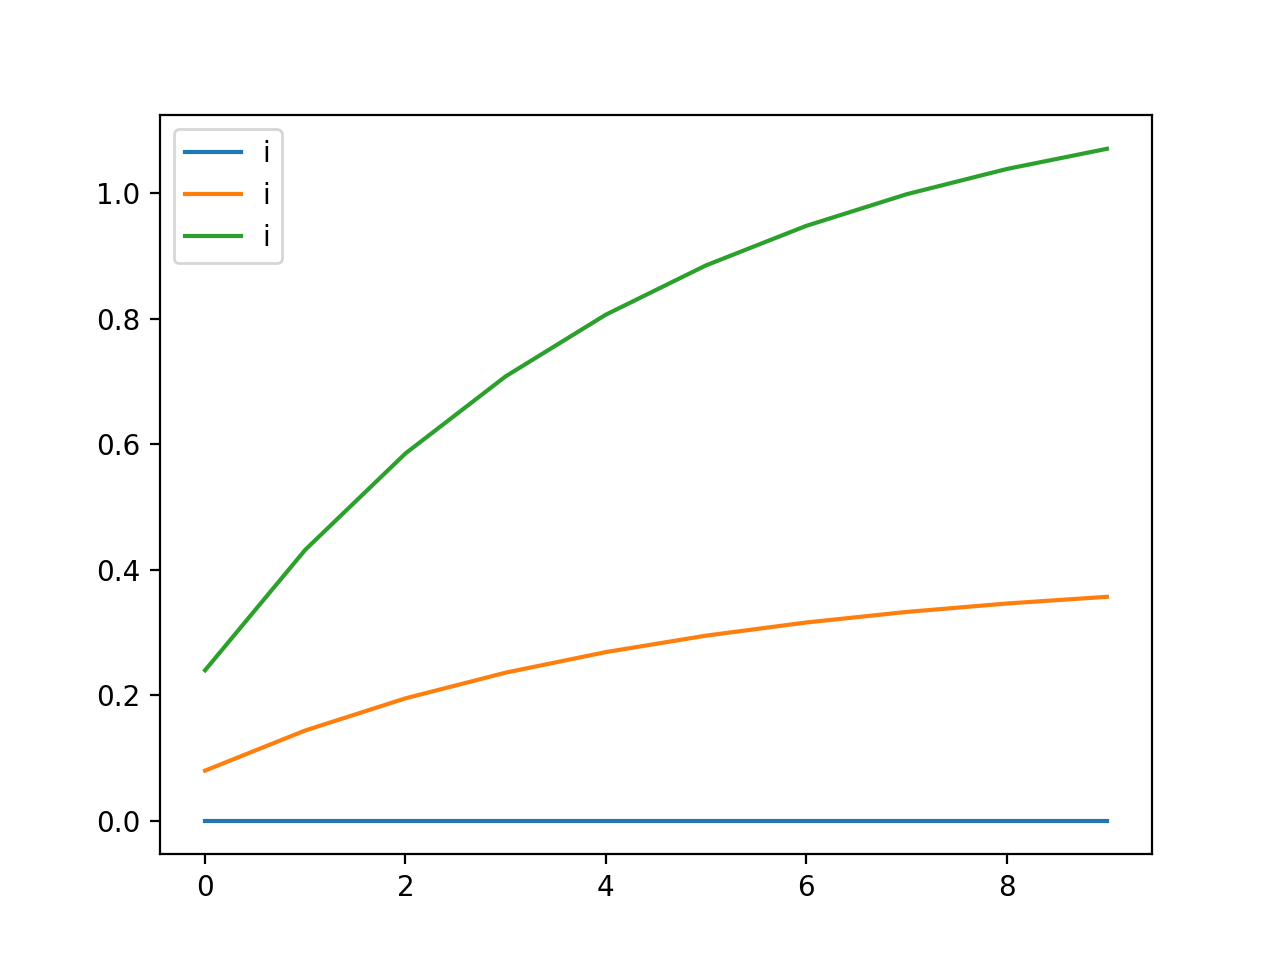
Plots state variables in a line plot based on a list of states over time.
- Example:
>>> cell = LIF()
>>> _, states = cell(torch.ones(10, 3))
>>> plot_neuron_states(states, "i")
(
Source code,png,hires.png,pdf)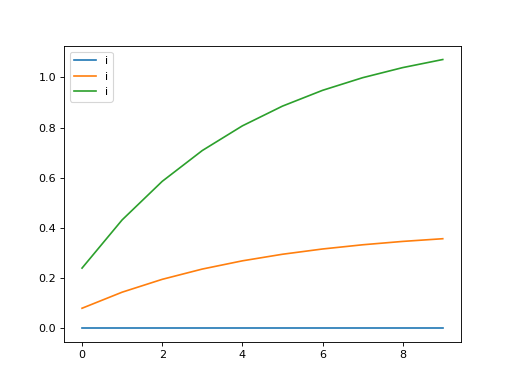
- Arguments:
- states (List[Any]): A list of state tuples containing state variables.
We assume the list is ordered by time.
*variables (str): A set of variables to plot. label (bool): Whether or not to render the label in the plot. axes (plt.Axes): An axes object to render on, if given.
- Returns:
A plt.Axes object for further manipulation or rendering.