norse.torch.utils.plot.plot_heatmap_2d#
- norse.torch.utils.plot.plot_heatmap_2d(data: Tensor, axes: Axes | None = None, show_colorbar: bool = False, **kwargs)[source]#
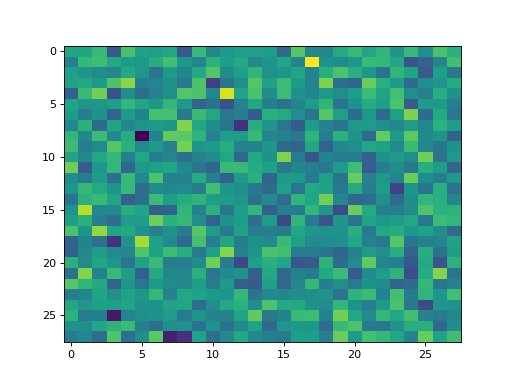
Plots a heatmat of two-dimensional data
- Example:
>>> data = torch.randn(28, 28)
>>> plot_heatmap_2d(data)
(
Source code,png,hires.png,pdf)
- Arguments:
- data (torch.Tensor): A tensor of data to plot in two dimensions
(typically spikes with time in the first dimension and neuron id in the second).
- axes (matplotlib.axes.Axes): The matplotlib axis to plot on, if any.
Defaults to
matplotlib.pyplot.gca()
show_colorbar (bool): Show a colorbar (True) or not (False). kwargs: Specific key-value arguments to style the figure
fed to the
matplotlib.pyplot.imshow()function.- Returns: