norse.torch.utils.plot.plot_histogram_2d#
- norse.torch.utils.plot.plot_histogram_2d(spikes: Tensor, axes: Axes | None = None, **kwargs)[source]#
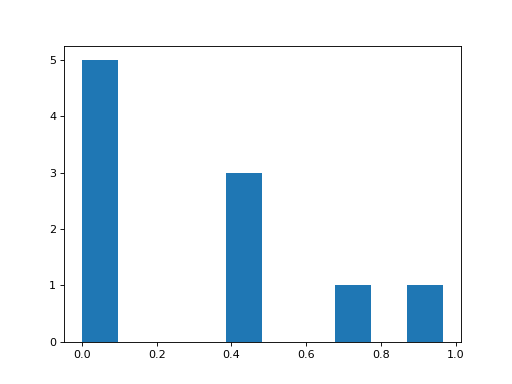
Plots a histogram of 1-dimensional data.
- Example:
>>> cell = LIF()
>>> data = torch.ones(10, 10) + torch.randn(10, 10)
>>> spikes, state = cell(data)
>>> plot_histogram_2d(state.v)
(
Source code,png,hires.png,pdf)
- Arguments:
data (torch.Tensor): A tensor of single-dimensional data. axes (matplotlib.axes.Axes): The matplotlib axis to plot on, if any.
Defaults to
matplotlib.pyplot.gca()kwargs: Specific key-value arguments to style the figure fed to the
matplotlib.pyplot.hist()function.- Returns: