norse.torch.utils.plot.plot_scatter_3d#
- norse.torch.utils.plot.plot_scatter_3d(spikes: Tensor, axes: List[Axes] | None = None, show_colorbar: bool = True, **kwargs)[source]#
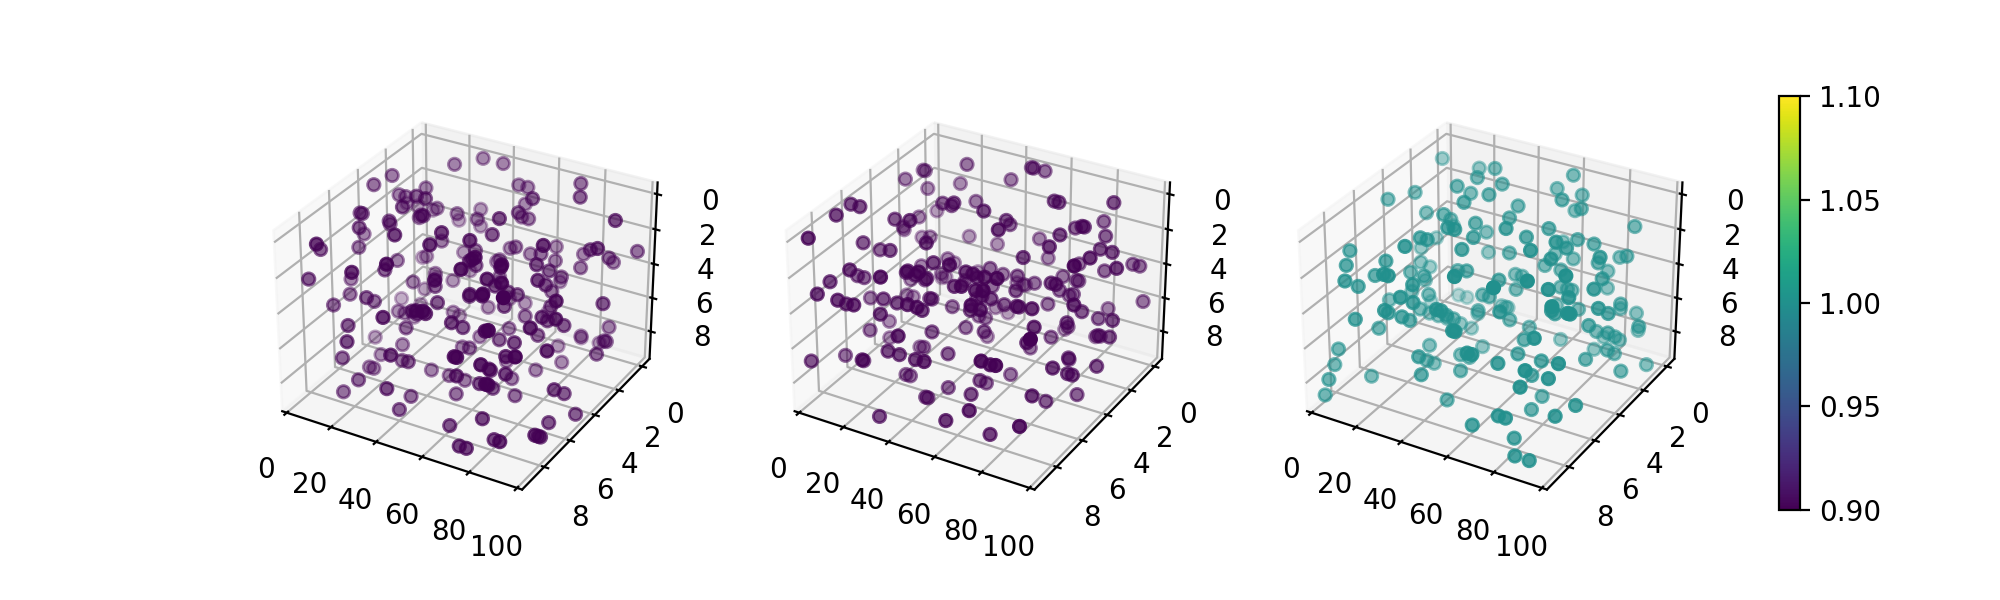
Plots spike activity in time. If multiple layers are given, the layers will be shown in subplots. Expects a named tensor in three dimensions (L, X, Y) or four, with time (T, L, X, Y).
- Example:
>>> distribution = torch.distributions.bernoulli.Bernoulli(torch.tensor([0.02]))
>>> data = distribution.sample(sample_shape=(3, 100, 10, 10)).squeeze()
>>> data.names = ('L', 'T', 'X', 'Y')
>>> plot_scatter_3d(data)
(
Source code,png,hires.png,pdf)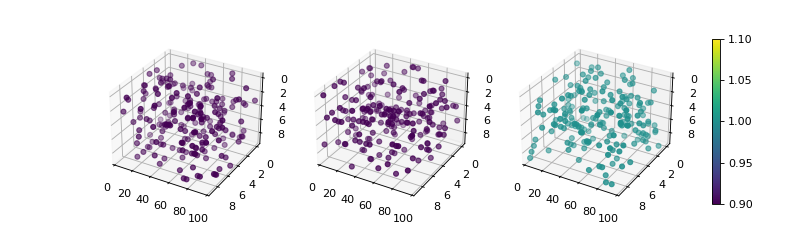
- Arguments:
- spikes (torch.NamedTensor): A tensor named with four dimensions: T (time), L (layer), X, Y.
Expected to be in the range \([0, 1]\).
- axes (List[plt.Axes]): A list of Axes that should have the same length as the L dimension in
the spike tensor. Defaults to None, which will generate a grid for you.
show_colorbar (bool): Show a colorbar (True) or not (False). kwargs: Specific key-value arguments to style the figure
fed to the
matplotlib.pyplot.scatter()function.- Returns:
A list of :matplotlib:class:`matplotlib.axes.Axes`