norse.torch.utils.plot.plot_heatmap_3d#
- norse.torch.utils.plot.plot_heatmap_3d(spikes: Tensor, show_colorbar: bool = False, **kwargs)[source]#
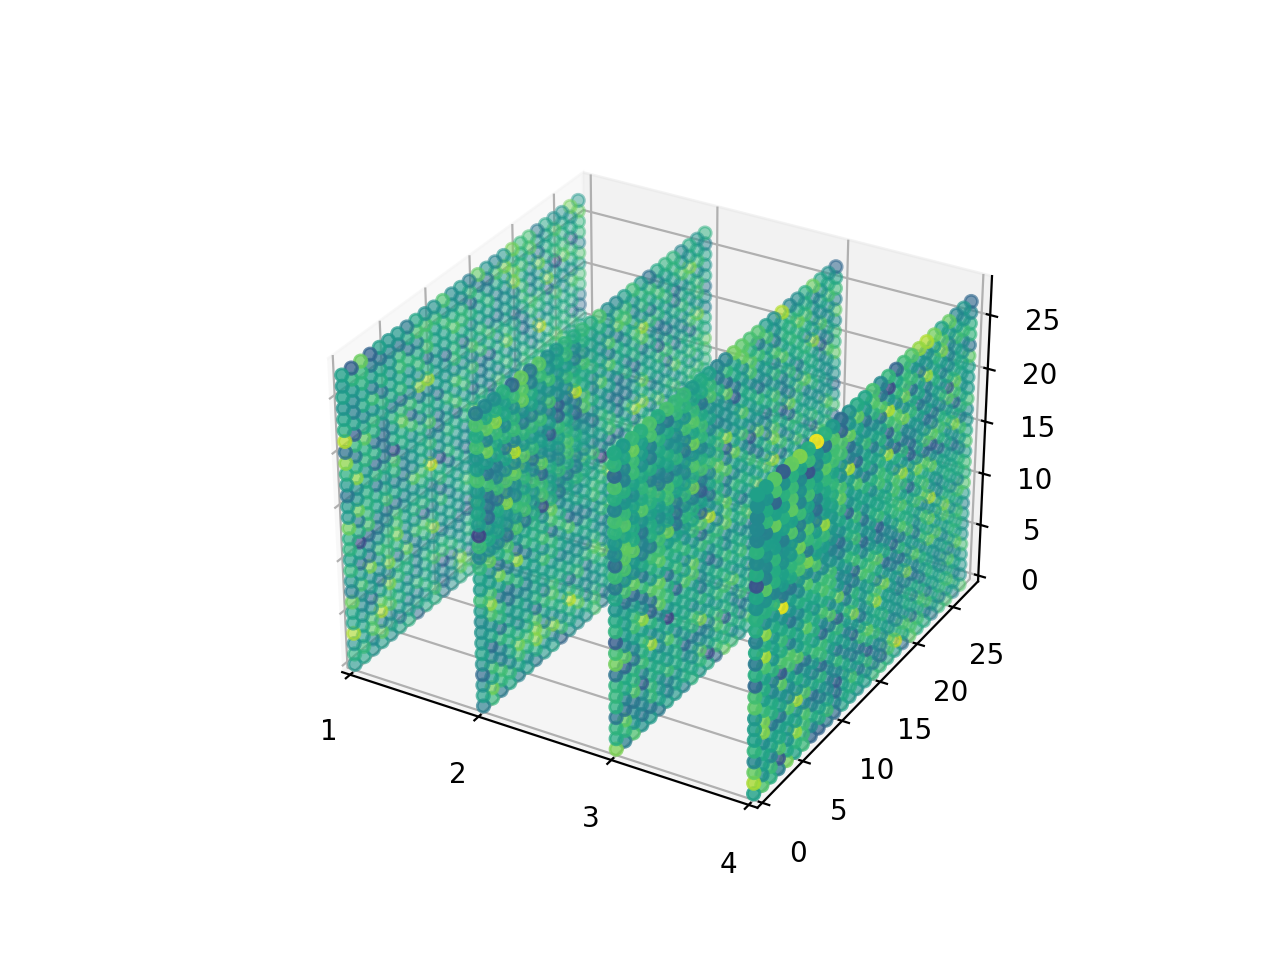
Plots heatmaps for some activity in several layers. Expects a named tensor with names=(‘L’, ‘X’, ‘Y’). Instead of using the
matplotlib.pyplot.imshow()matplotlib function, we make use of thematplotlib.pyplot.scatter()function to disperse points in 3d.- Example:
>>> import torch
>>> from norse.torch.utils.plot import plot_heatmap_3d
>>> data = torch.randn(4, 28, 28, names=('L', 'X', 'Y'))
>>> plot_heatmap_3d(data)
>>> plt.show()
(
Source code,png,hires.png,pdf)
- Arguments:
- spikes (torch.NamedTensor): A tensor named with four dimensions: T (time), L (layer), X, Y.
Expected to be in the range \([0, 1]\).
show_colorbar (bool): Show a colorbar (True) or not (False). kwargs: Specific key-value arguments to style the figure fed to the
matplotlib.pyplot.scatter()function.- Returns:
An :matplotlib:class:`matplotlib.axes.Axes` object